
Measuring Downtown Revitalization
March 2017 - prepared for National Main Street Center, completed by Jon Stover & Associates
Fiscal Impact Analysis of Public Sector Spending on Four Main Street Programs
City of Boston / State of Washington / State of Pennsylvania / State of Oklahoma
May 2016 - Brian O'Connor, Economic Development Specialist
There’s an old saying that money is like water and flows to the path of least resistance. Where market opportunities appear to be lacking, money will travel elsewhere along with the physical and human capital. Therefore, in order to level the playing field and make investment attractive, communities must often provide financial incentives to lure private capital.
Perhaps the reason the downtown is unable to attract investment is because there are extraordinary building costs associated with obsolescence, structural, or fire suppression. In such cases it may be appropriate to provide public incentives via low interest loans or grants for building improvements. Similarly, perhaps the reason buildings are vacant or underutilized is due to a lack of a strong retail or residential market. In such cases, lease subsidy programs may be offered by the public.
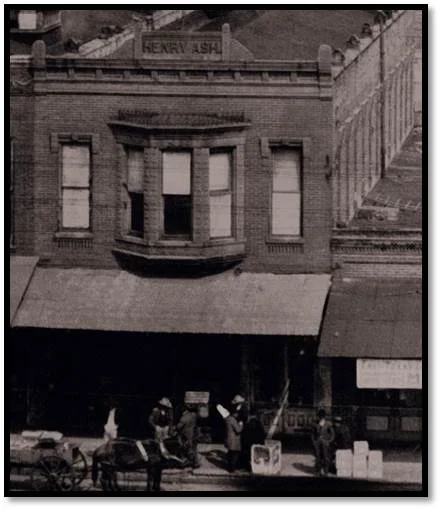


In Palestine, public incentives via low interest loans or grants were helpful in restoring a historic downtown building that has been changed considerably over the years. The Texas Main Street design staff helped the owners visualize a full restoration of the building based on historic photographs.
No matter what the challenge, it is always necessary to justify contributing public dollars toward private ventures. In times of declining municipal revenues, it is imperative that public programs demonstrate a positive costbenefit relationship, and that the cost to rehabilitate or re-purpose
downtown buildings is equal to or less than the value of the buildings to the community. If it is not, then participation may not be in the public
interest.
It seems obvious, but program evaluation tends to get pushed to the end of priority lists. However, the purpose of measuring the effectiveness
of public expenditures is to replace rumors with fact about what the community is trying to accomplish. Accordingly, Main Street managers
should perform some comparative analysis on how well each of their programs is leveraging private capital.
As Main Street incentives cover the spectrum from construction loans to operational support, it is recommended that the collection, evaluation, and dissemination of public subsidies be divided into four categories: 1. Investment as a percentage of property value; 2. Investment per square foot; 3. Public’s Return-on-Investment; and 4. Other private investment.
The issue of public subsidies is complex and there is little agreement on how their effects can be adequately measured. Part of the lack of agreement is the complexity of the problem of evaluating the “But For” impact of subsidies on the local economy. The fact is while it is repeatedly argued that public investment is a necessary precondition for private businesses to thrive, most projects fail to test and measure if the subsidies were truly necessary or produced the desired results. Rather, we operate from the premise that any private business activity is better than nothing.
However, Main Street managers have access to first-hand evidence that demonstrates their effectiveness in leveraging private capital. Such measures can demonstrate the value of each program and influence public policy objectives. Public incentives are most effective when they are expressly targeted toward a downtown agenda. Measuring the economic impact of each program will help influence policy decisions by identifying market trends, return-on-investment, and where the level of investment is occurring within the district.
Many of the measurable results from brick and mortar projects may take months or even years to fully appear. As these lagging economic indicators are seldom tracked, it is important for Main Street managers to make the case for the importance of their programming today.
This article is not about which methodologies should be used; rather, managers should see this article as an idea of how data might be viewed to
compare and contract results between various programs.
Program Background
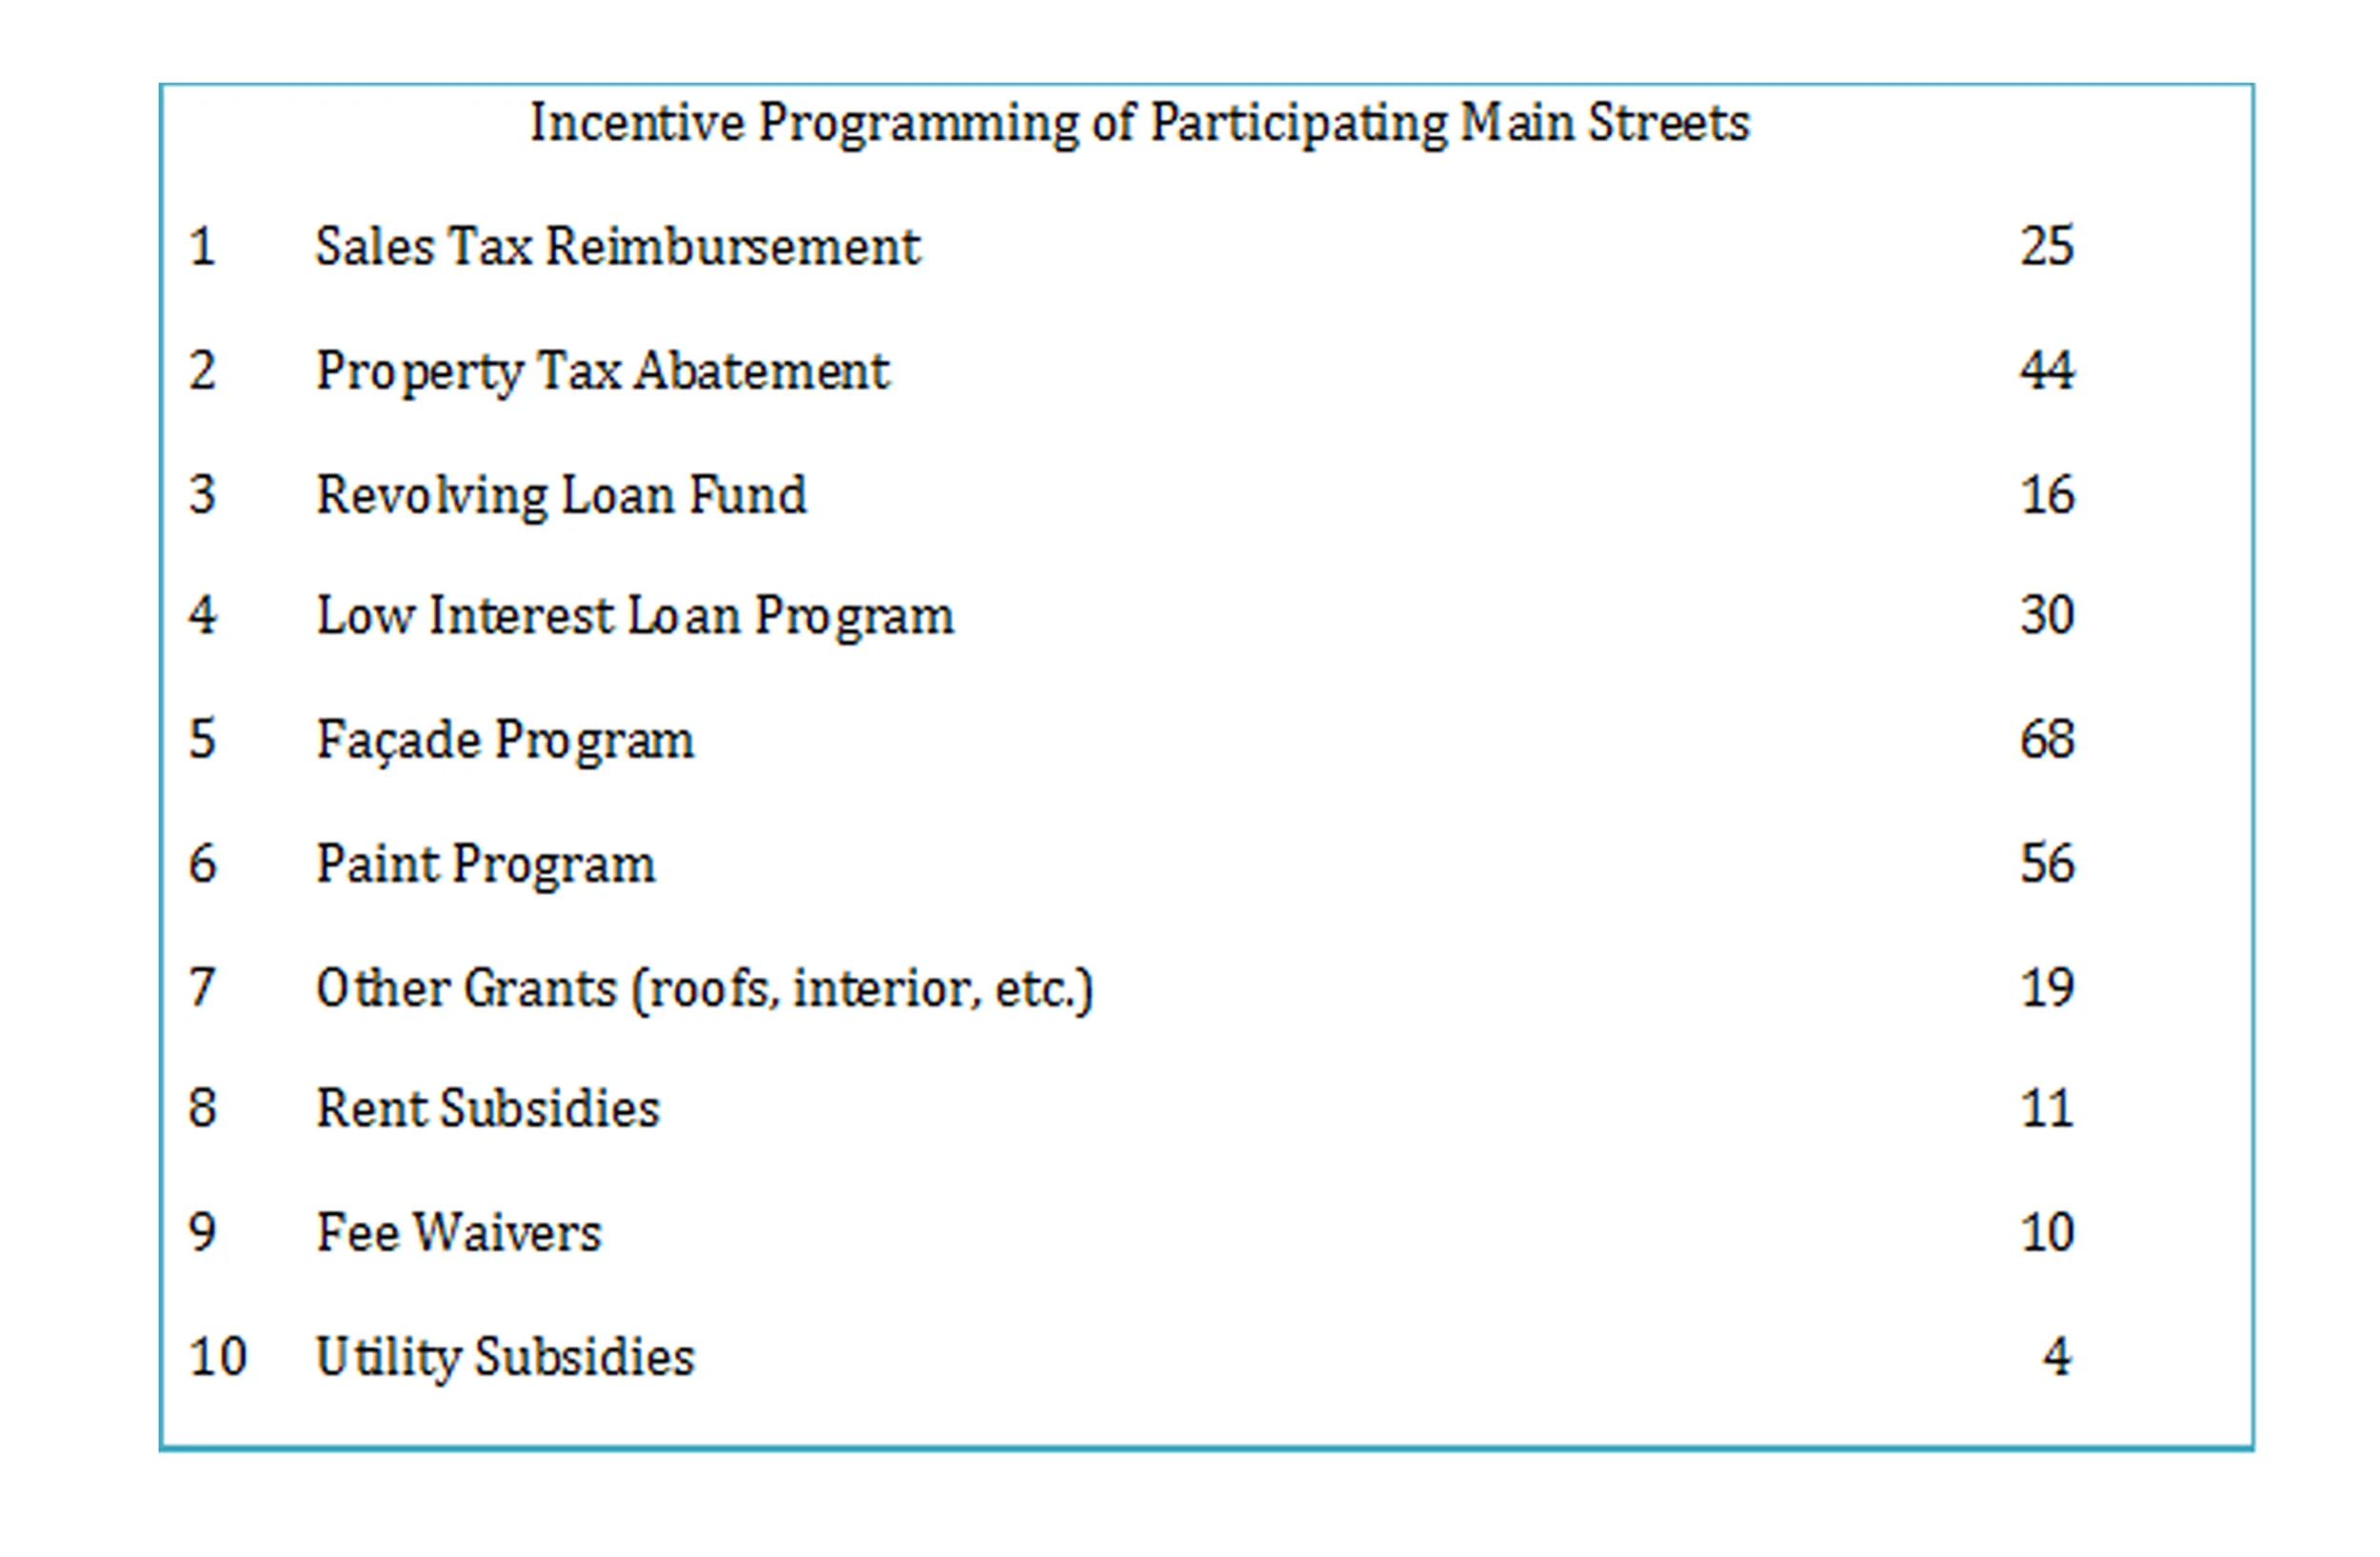
According to the November 2015 report, 10 Criteria Survey of 70 Main Streets, the public financial incentives offered by Main Street communities
fell into 10 common categories.
As public subsidies can become unpopular during difficult budget cycles, Main Street managers should monitor each program as if it were part of a downtown investment portfolio. In doing so, managers can be more strategic in their use of public resources. Moreover, data can identify changes in the market place and suggest how public participation might be increased or redirected. Moreover, the data will demonstrate to the community that tax payer dollars are being wisely invested.
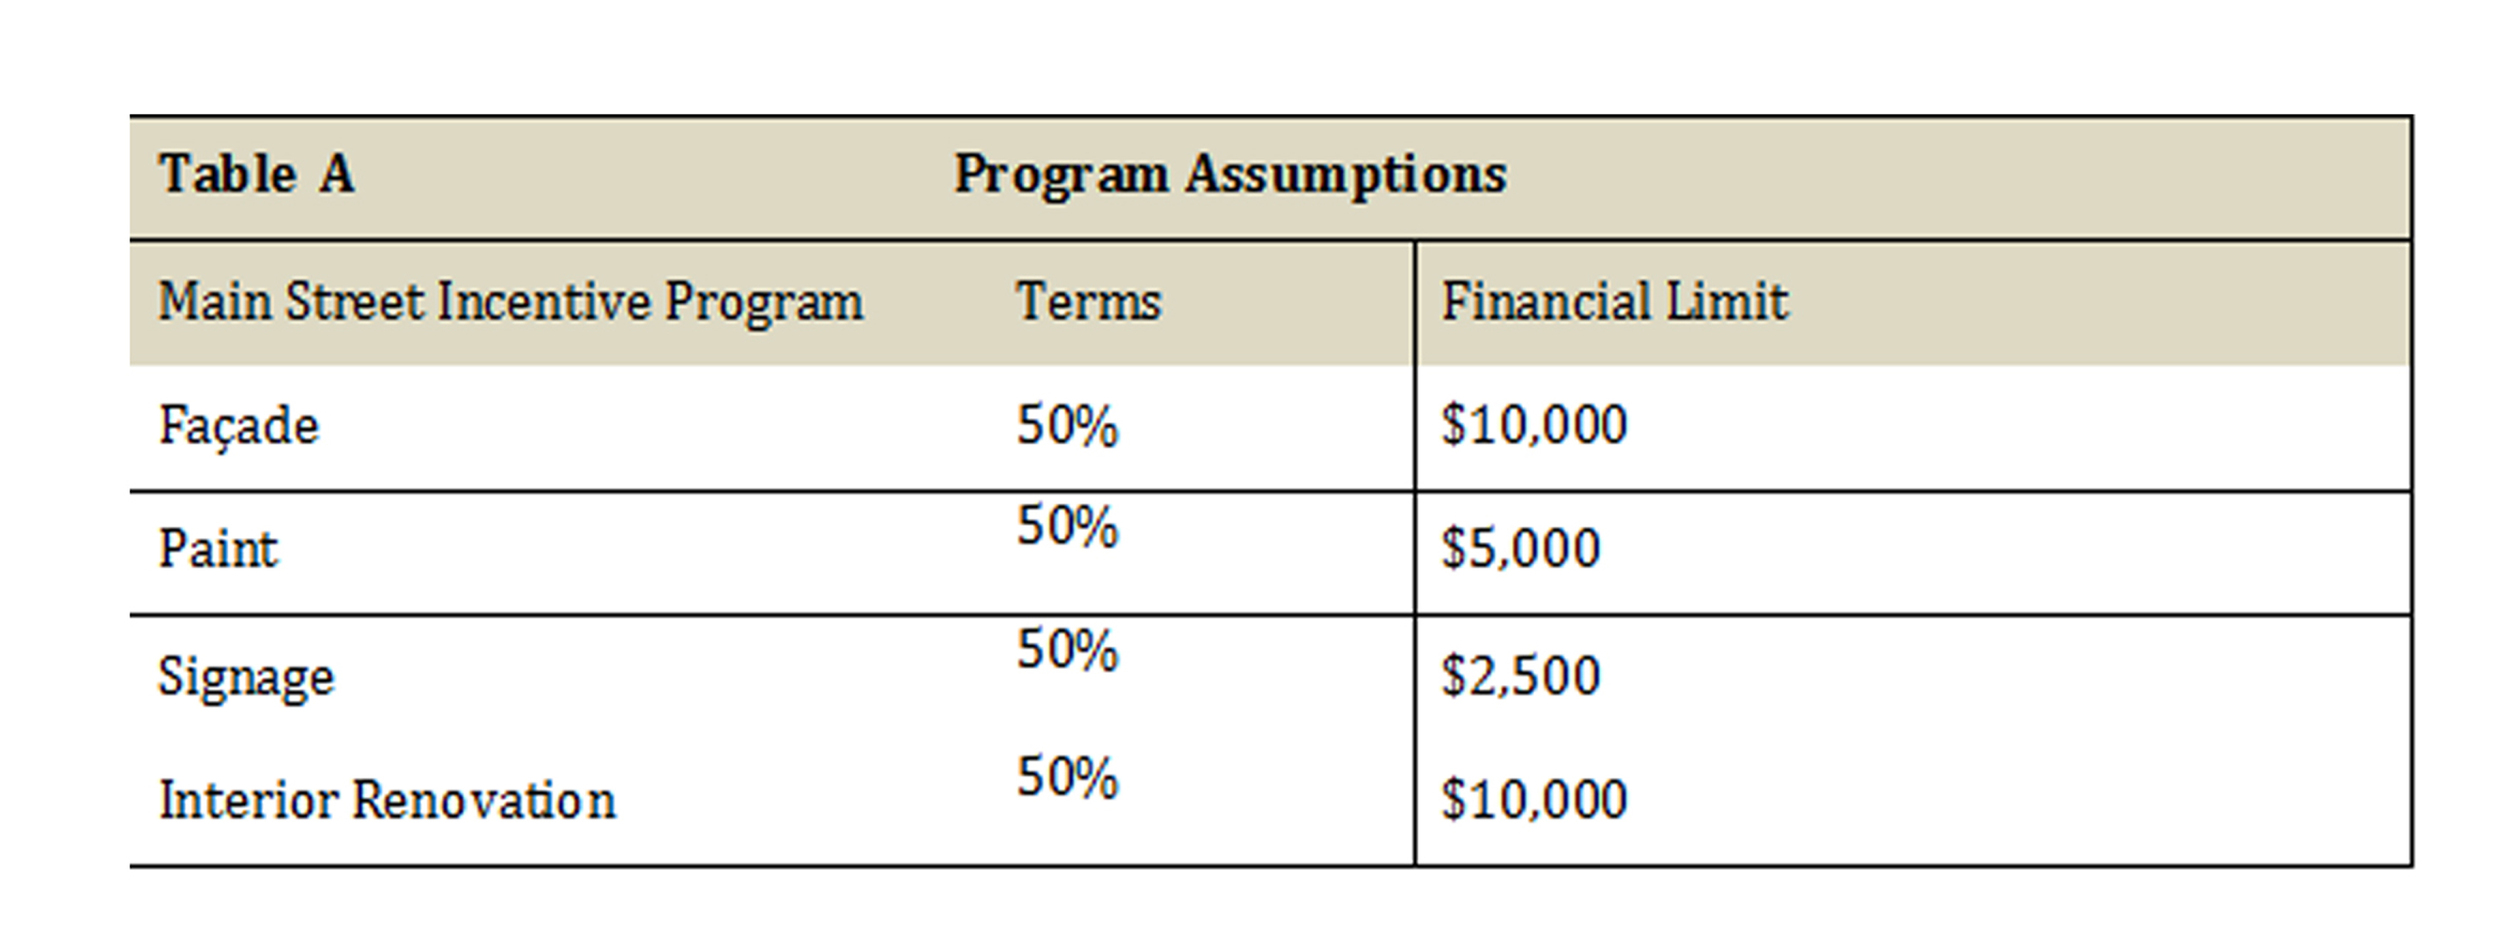
(Top) Table A provides some program assumptions for measuring the impact on
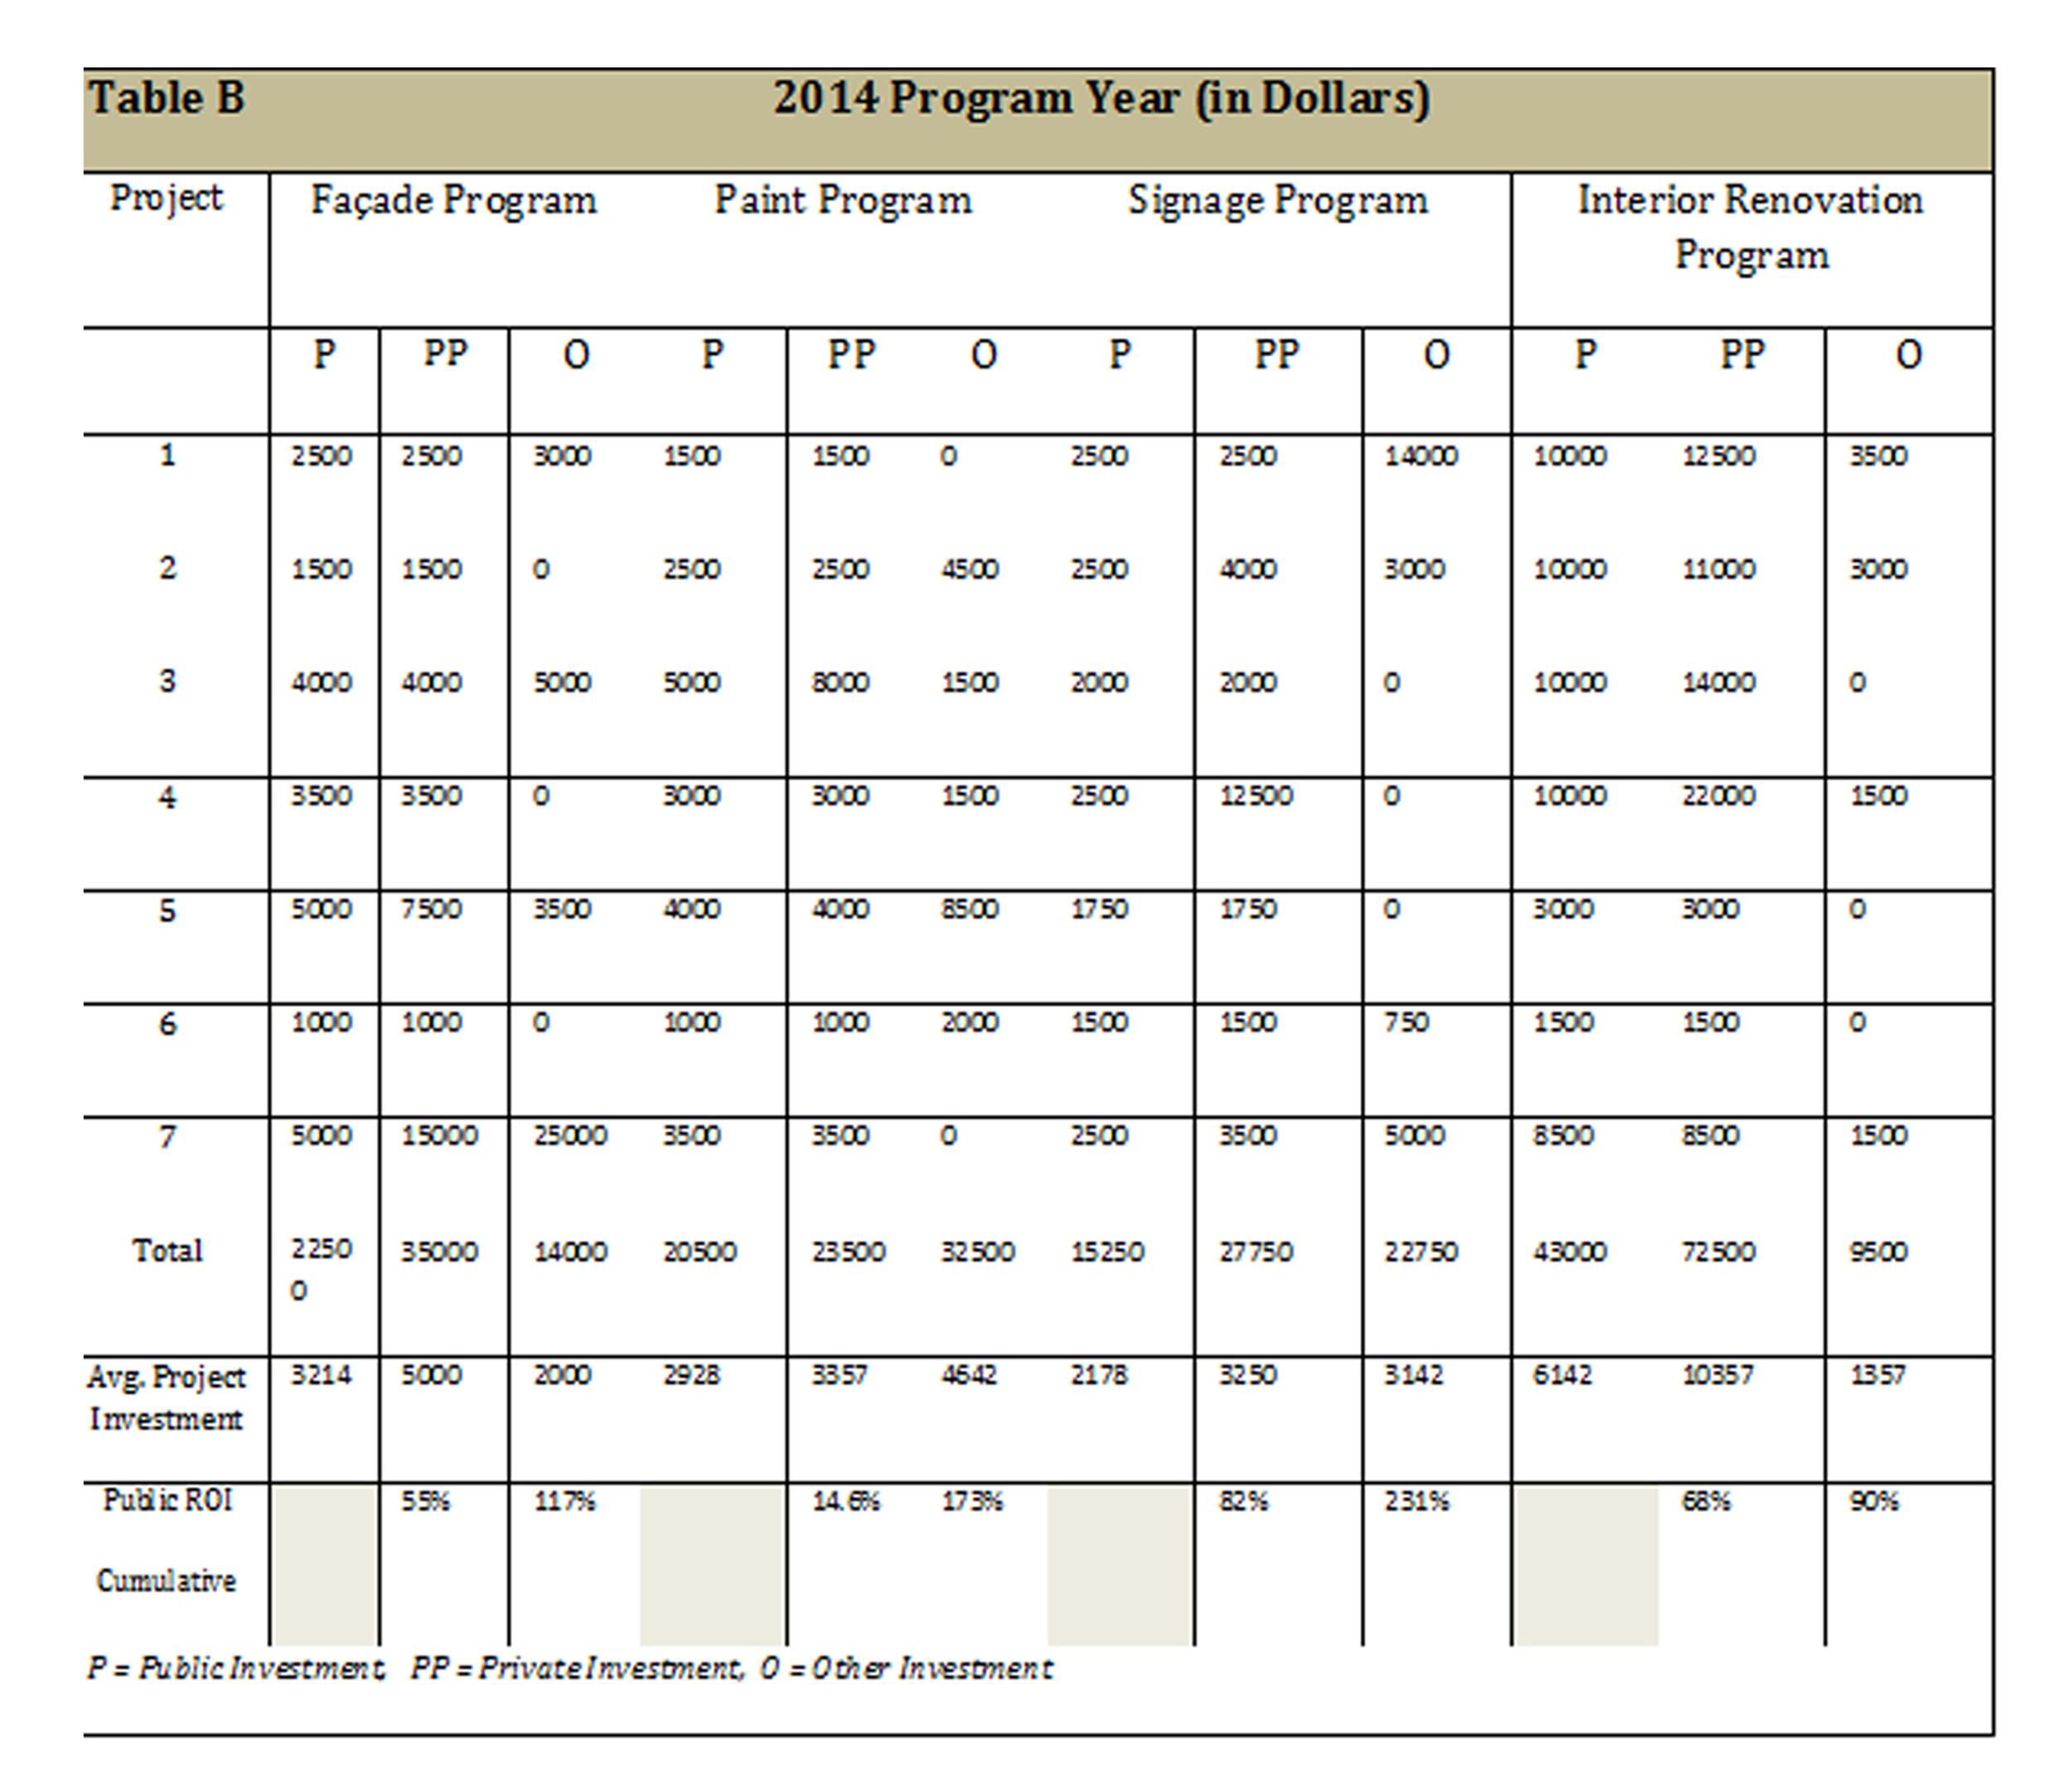
public incentive programs (Façade, Paint, Signage, and Interior Renovation). Numbers are hypothetical and used only for illustrative purposes. (Bottom) Table B shows how program data might be used to determine the Return-on-Investment on a portfolio of public incentives (Façade, Paint, Signage, and Interior Renovation) and the spillover benefit of some programs over others.
- Starting Point. Managers might consider augmenting some of the previous Quarterly Reinvestment data to establish a baseline. Data should focus on how private investment is leveraged, demonstrating that financial incentives like façade and tax abatement programs produce revenues in excess of the tax dollars sacrificed. As most of the categories for measure are a standard practice of the Main Street program, descriptions of each of the categories will be kept brief.
- Investment as a Percentage of Property Value. This is a measurement of the total project investment as a percentage of the property’s values. This figure indicates the level of investment required to maintain, adaptively re-use, or renovate a downtown building. Measuring this figure helps identify if supplemental financial incentives such as tax abatement or construction loans may be required to make projects financially feasible.
- Investment per Square Foot. Measuring investment on a square foot basis allows comparisons between buildings of different age, size, and character. Collection and methodology needs to be standardized so that information is regular and comparable. Real estate comparisons on a per square foot basis are industry standards and allows comparisons outside the district that is understood by developers, investors, realtors, and bankers.
- Public’s Return on Investment (ROI). Measures the return on the public’s investment. Metrics should take into consideration the structure of the Main Street program, e.g., if the city offers a façade program with a 50% match up to $10,000. Naturally, one might assume that a property owner has a distinct motivation to invest up to the point where the rebate stops. However, if property owners are investing up to the threshold and many times beyond it, may be a sign that the level of rebate is inadequate for the level of rehabilitation required, or that other financial incentives may be considered.
- Other Investment. It is equally important to capture the full extent of private investment. A $5,000 façade incentive may have only induced the property owners to match the city’s investment on the exterior; however, it spurred the owner to make investments to the roof, interior, or mechanical systems. This figure should be included when measuring the overall impact of a program.
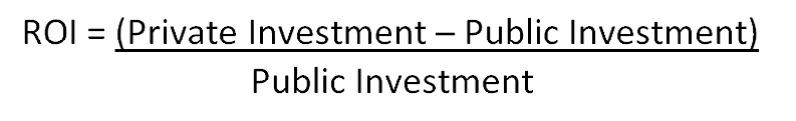
The project’s Return-on-Investment (ROI) is a measure to evaluate the efficiency of individual programs as well as the entire portfolio relative to the public’s investment. The return on investment formula:
The public’s return on private investment under the Façade Program produces a public ROI of 55%. This is not a substantial return given the fact that the program provides a 50% match. Apparently, property owners are making exterior improvements only to the point where the city is
willing to match their investment. However, when taking into account the Other Investment as a result of the program, the positive spillover effect increases the public’s ROI to 117%. This occurrence is not coincidental; as research has demonstrated that investment into real property tend to cascade beyond a certain threshold.
Conversely, the Paint Program does not appear to encourage property owners to invest to the program threshold and provides a modest public ROI of 14.6%. However, the cumulative public ROI comes to 173% and indicates that when property owners make an investment into building
maintenance (paint) that other property improvements can be anticipated.
The Signage Program produces a respectable 82% ROI on the public’s investment. Again, the cumulative public ROI rises to 231% when taking into account all property improvements. However, be mindful that while some programs provide the greatest return on the public’s investment (paint and signage) they may do little to stabilize the condition of the property or increasing the property’s taxable value. Case in point, the Interior
Renovation Program, produces a modest a 68% public ROI and a cumulative ROI of 90% when other investments are taken into consideration. However, the Interior Renovation Program is the most likely to assist a vacant building in becoming re-occupied, which in turn produces jobs, increased utility usage, rents, sales taxes, etc. Moreover, the Interior Renovation Program is most likely to address code violation, and ensure the sustainability of the property. As ad valorem tax account for 80% of all municipal tax revenues, your program’s influence on property values becomes critical.
Lastly, you may want to begin tracking sales tax activity within your Main Street district. There is a direct correlation between typical Main Street programming and the sales taxes activity within the district. Sales taxes will show growth or deceleration of personal consumption spending across
your downtown’s retail industries. Reports may be ordered from the Texas Comptrollers Revenue Accounting Division.