You know those reinvestment reports that Main Street programs complete? It turns out that they can do a lot more than just track reinvestment: they can also help you figure out your Main Street program’s long-term progress.
The National Main Street Center began compiling the reinvestment statistics it received from statewide Main Street programs in the mid-1980s. Several years later, the Center noticed a very interesting pattern: When the Center’s staff averaged all the data from local Main Street programs throughout the country together and graphed it by the number of years these programs had been active, a very distinctive curve appeared on the graph. And, the same distinctive curve appeared for several sets of data: the amount of money invested in physical improvements, the net number of jobs created, and the net number of businesses created.
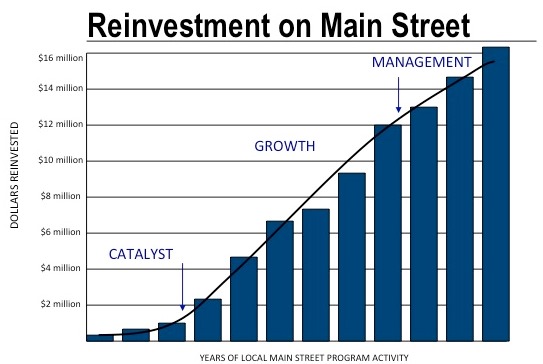
Here’s what it looks like: The curve starts out gradually edging upward. Then, around the 3rd-5th year of program activity, the curve arcs upward – and continues to curve upward, gradually leveling off around the 15th-20th year of program activity.
The Main Street Center realized that, in the first few years of Main Street program activity, physical improvements tend to be modest in scale, typically involving projects like taking care of deferred maintenance, upgrading signs, maybe some small-scale façade rehabilitation projects. So, the curve shows a small uptick in new investment, job creation, and business growth.
Then, after a few years, rehabilitation activity begins picking up. Businesses are earning more, and that means that they can pay slightly higher rents. With slightly more rental income, property owners can afford to make property improvements. This is a critical moment in the revitalization process. When downtown property owners begin making more substantial improvements to their buildings than they are able to do in the first several years, property values increase, and that means that the local government can collect slightly more in property taxes. With more property tax income, the local government can invest slightly more in public improvements and other downtown development incentives ¾ and, in turn, that encourages more private-sector investment and helps attract more shoppers and visitors.
After 15 or 20 years of revitalization work, many of the buildings that have needed rehabilitation have been improved, and building rehabilitation typically begins to level off.
The Main Street Center staff realized that this pattern was essentially illustrating three distinct and predictable phases of revitalization activity:
Catalyst Phase: During the first several years of Main Street program activity the Main Street organization encourages low-cost, but high-visibility physical improvements; begins changing public perceptions of the district; helps businesses improve sales performance; and examines the market possibilities that might exist for its district, ultimately determining the economic development goals towards which it will guide the district over the next decade or two.
There are typically four things that signal the transition from the Catalyst Phase to the Growth Phase. First, the organization has learned how to effectively manage design changes. Second, the organization has a good sense of what the district’s best role might be within the regional economy. Third, it has begun to act strategically, rather than responding to problems and opportunities on an ad hoc basis. And, fourth, it is regarded within the community as an effective organization. When the organization has reached this point, it is ready to transition into its next phase.
Growth Phase: During the Growth Phase, the Main Street organization uses the skills it learned and the economic development strategy it outlined in the Catalyst Phase to increase the district’s sales, develop new businesses, encourage upper-floor development and larger-scale physical improvements, and attract new investment. During this phase, most major building rehabilitation work takes place, and the district’s ground-floor and upper-floor occupancy rate gradually grows.
Unlike the transition from the Catalyst Phase to the Growth Phase, which is marked by four organizational benchmarks, the transition from the Growth Phase to the Management Phase has two quantifiable measurements: by the end of the Growth Phase, there is generally no more than a 5-10 percent overall vacancy rate (including upper-floor spaces) in the district, and at least 80 percent of the buildings that needed major rehabilitation have been rehabbed.
Management Phase: With occupancy up and most buildings rehabilitated, the Main Street program’s role shifts towards maintaining and managing the positive changes that have taken place.
Money! Not only do these three phases have implications for organizing a Main Street program’s activities, they also have significant implications for its funding.
For example, during the Catalyst Phase, the Main Street organization has not yet established a track record that might attract investment. Instead, it must raise money by getting stakeholders excited about the possibilities of a revitalized downtown, asking them to help support this dream.
(Editor’s note: Ms. Kennedy Smith is referring to a typical pattern in many other states where the local Main Street programs are non-profits and spend considerable effort raising money to support operations and projects. In Texas, some programs operate in this manner, but most are in city government and generally only raise money for special projects not for operations. However, the special-projects fundraising can sometimes be substantial. Several paragraphs down, Ms. Smith discusses struggles some programs have in finding ongoing funding – this might not be an issue for a program that is not funding operations; however, a program still struggling to capture broad-based and/or political support after several years should look at the same goal-setting process.)
But, by the time the organization begins making the transition to the Growth Phase, it has (hopefully) established a credible track record and has clearly defined and outlined the major economic development strategies it intends to pursue for the next 5-10 years. At this point, stakeholders shift their attention to investing in these major strategies and their component activities. And, the sources of funding might become broader, also, as it becomes clearer which specific activities might be supported by federal and state grants, private equity, foundations, tax revenues, and other funding sources not often available to start-up organizations.
As the district’s economic value increases (increased retail sales, higher property values, increased tax revenues, more jobs, etc.), a small percentage of that new economic value can usually be used to provide ongoing core support for the Main Street program. So, for example, a mature Main Street program might create a Business Improvement District, with the district’s property owners volunteering to pay an assessment based on property value to support the district’s ongoing management. Or, some of the Main Street program’s activities might be supported by Tax Increment Finance revenues generated by the higher property values resulting from revitalization activity.
What’s wrong?
Understanding these three phases can also help a Main Street organization pinpoint problems it might be having. For example, if the program has been active for three or four years and is struggling to find ongoing funding, the problem is likely that it has not yet defined those two or three major economic development goals that it plans to pursue over the next decade or so – so, stakeholders are unsure of what they are being asked to support. Or, if a Main Street organization has been active for a long time but is finding that the marketing and business development activities that used to work well aren’t working so well any more, it might be time for it to cycle back, conduct some new market research, and outline a new set of economic development goals for the next decade.
The next section by the Texas Main Street Coordinator Debra Drescher looks at how some of Texas’ Main Street cities compare to the three phases.
The late 1980s and 1990s were a period of growth for the new state office as well, as new cities were designated and the network expanded. Today, we have numerous communities in our network that have been officially designated for many years and we continue to take in new communities as well. Using Kennedy’s assumptions as a starting point for comparison, we looked at several Texas Main Street communities of different population sizes and in a variety of locations in Texas that have participated since the 1980s or 1990s to see if the expected patterns existed. One would expect to see an initial period of starting reinvestment/rehabilitation growth in the first five years, followed by a spike over the next decade and a more constant line since that time as the programs exist in their management phase (See Reinvestment Expectations graph).
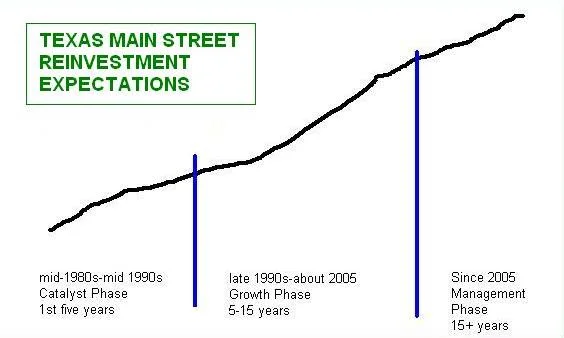
This chart shows a sample timeline for the catalyst, growth and management phases on which Texas’ earliest designated Main Street programs would be. For this issue, due to constraints of time and space, we only collected comparison data for catalyst and growth phases, not management phases.
The chart below takes the hypothesis presented in the feature reinvestment article and reviews rehabilitation activity of three selected Texas Main Street communities that have finished their initial 3-5 year catalyst phase and are nearing the end of their growth phase. The graphs show that during their initial start-up period, rehabilitation activity was modest but once the foundation had been laid, rehabilitation activity dramatically picked up during the second phase between 5-15 years.
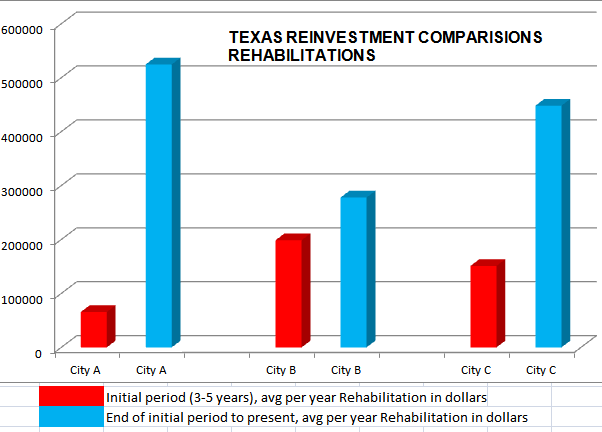
This dramatic upswing was especially true for City A and City C. However, in reviewing data for this article, we did find that there are many Main Street programs in our Texas network that did not follow the pattern and showed a higher rate of growth during their initial phase than during the growth phase. An assumption could be made that in these instances there had perhaps been a pent-up demand for available space in the downtown and the creation of a structured Main Street effort spurred activity quickly, thereby allowing a lot of reinvestment during the initial period. Or perhaps the high level of enthusiasm that is created in the early years of a program caused some previously tentative projects to take hold. Sometimes anomalies in reporting (such as a staff vacancy when reinvestments may not be consistently collected) could also cause variations in reporting records.
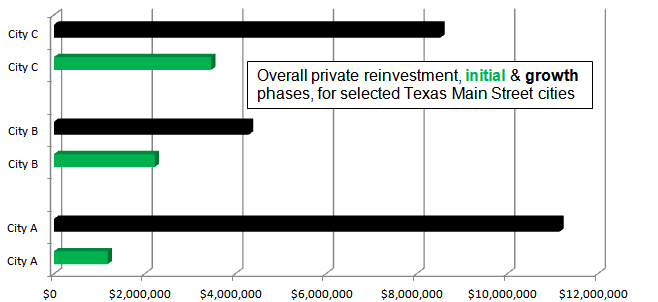
The chart above expands the review of initial- and growth-period rehabilitations to look at private reinvestment in several other selected long-time Main Street communities. This would include not only rehabilitations but also properties bought and sold and new construction within the historic Main Street district. Again, there are many other communities in our network that haven’t followed the theoretical pattern laid out in the feature article of modest initial growth and rapid second-stage growth. That not all programs follow the hypothesis is to be expected in a program such as Texas’, which has widely varying participating communities all across the state.
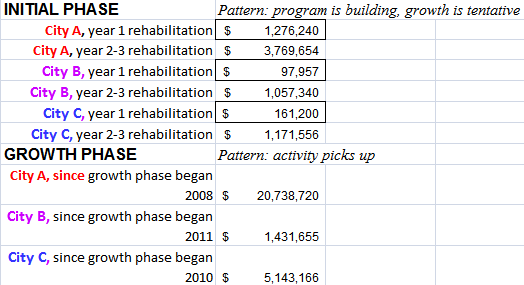
Evidence of the pattern Kennedy Smith lays out can be directly seen in the rehabilitation reinvestments reported by three newer Main Street cities (urban and small) that have recently completed their initial phases and are now solidly in their growth phase. Looking at the chart below each of these programs began since 2005. Notice the pattern: modest growth (or in the first year) at the start and for the past several years, a very solid pattern of strong growth.
In the end, there are many ways to calculate return on investment when it comes to judging the value of the Main Street effort and each local community will look for elements of success that match their community’s needs and desires. Some of it will be grounded in numbers ¾ jobs and businesses created, buildings restored, etc. ¾ but most communities also know that the value of Main Street comes from a combination of what the numbers are saying plus the social and cultural meaning the Main Street effort provides. There is energy that one can feel in a vital downtown; there is self-satisfaction that comes from being a part of an effort that must have volunteers to succeed; and there is ever-growing community pride in a city with a belief in the value of its past and the need to preserve it while creating a useful downtown for its present and future.
At the state office, we also add to the return-on-investment discussion with an internal look at the value of our own services (VOS). We have been collecting this data since Fiscal Year 2010 and, despite declining changes in our staff size, our output has remained relatively constant.
During this time, we completed two dozen multi-day assessment site visits under our previous Preserve America grant (ended 2012); conducted numerous multi-day resource team visits to newly entering communities along with regular site visits for existing programs to provide expertise and advice; provided considerable higher-level economic development assistance to multiple communities through our contract with The CLUE Group and brought the network together 2-3 times each year for training and professional development in multiple Main Street communities. To point out just a few of the areas we look at, we showed an average of 88 site visits annually upon request to provide services and an annual average of 3,423 hours spent to complete requested projects (like design or strategic planning reports) for our programs (this does not include the regular day-to-day assistance provided like responding to your emails, phone calls or the listserv). Additionally, during this time, the number of design projects we’ve worked on has resulted in between $1.65 million and more than $9.2 million in projects completed annually for a total over the four periods of $20,235,545.
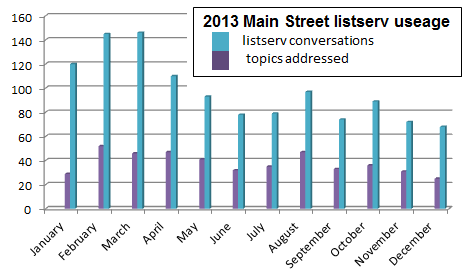
Just as importantly, the power of discussion among peers helps maintain the strength of the network. And as the chart on the right shows the Texas Main Street listserv is a highly used resource for managers. During the year, there were 1,171 e-conversations on 454 different topics shared on the Texas Main Street Listserv. Topics ranged widely from managers looking for advice on code enforcement issues, creating tax freeze documents, and implementing sidewalk obstruction ordinances to announcing important completed projects to questions about ADA compliance in historic buildings, requests for samples of preservation ordinances and guidelines and suggestions for celebrating preservation month.
In December, Main Street manager Derek Hall used the listserv to proudly share the unveiling of Heritage Circle in downtown Luling, which features a circular area of stone benches and landscaping that encircles an 18 ft. tall pole clock. The inner circle has plaques honoring Luling natives who have achieved extraordinary things on the world stage. “This was a wonderful example of what can be accomplished if you can get everyone on board and pulling in the same direction,” says Hall. “This is just another small example how Main Street programs effect positive change in our respective communities.”
The Year in Review and What’s Ahead for 2014
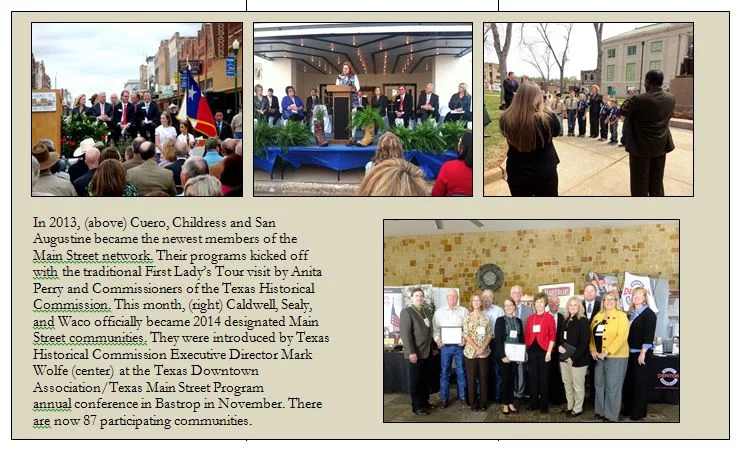
It was quite a year for the Texas Main Street program in 2013 and 2014 will be just as full. We visited Llano, La Grange, and Bastrop, all very successful Main Street communities for training and professional development. In 2013, we said hello! to some new Main Street programs when we welcomed Childress, Cuero, and San Augustine into the network. Thanks to the following people who helped TMSP staff by serving on the resource teams for these new programs: Scott Day, Urban Development Services, (San Antonio); Main Street managers/directors Sarah O’Brien (Nacogdoches), Donna Dow (Denison), Dan Kelleher (Vernon), Nancy Wood (Bastrop); Jim Bob McMillan, Texas Commission on the Arts; Mary Turner, former Forest Trail executive director; Adam Alsobrook, former THC project reviewer; Joshua Bloom and Kennedy Smith, The Community Land Use and Economics (CLUE) Group; and Quana Childs, THC architect.
We also said hello to Patrice Frey, the new Chief Executive Office of the National Main Street Center, when she visited four Texas Main Street communities as her very first stops on a nationwide listening tour to hear from local Main Street stakeholders and state coordinators. One of the stops in Texas that newly named National Main Street Center CEO Patrice Frey made was to Denton, where she got input from managers from Denton, Denison, Waxahachie, and Corsicana. Earlier, she had met with managers in McKinney, Grapevine, and Decatur. Her U.S. tour had a big impact on the development of the national center’s newly unveiled strategic plan that will guide our national organization for years to come.

Patrice Frey (second from left) visited with several Main Street Managers during her visit to Texas.
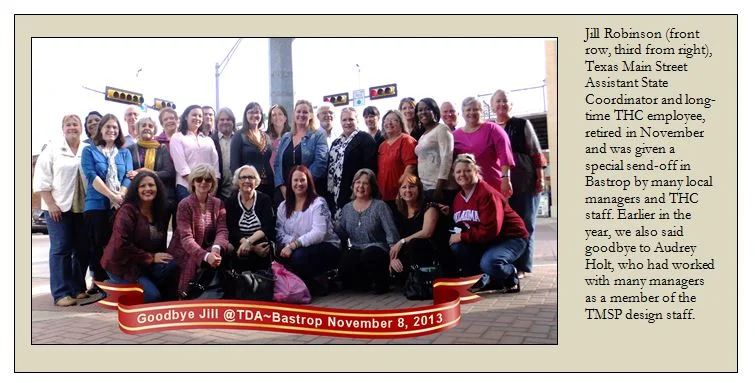
We also said goodbye to several valued staff during 2013 (see photo box p.8). But in 2014, we’ll welcome several new staff with new members (to be named) of the Main Street staff and new members of the Texas Historical Commission’s newly created Courthouse Square Initiative that will work under the Main Street umbrella. In late December when this issue of Main Street Matters was being written, we were reviewing applications to fill positions in planning, community and economic development and design. Considerable time will be spent in the early part of 2014 giving full definition and vision to this new agency initiative that is designed to further leverage the significant stand-alone investment that goes into restoring a Texas Courthouse with the broader Main Street concepts.