
WHY DO A RETAIL GAP ANALYSIS
November 2014 Main Street Matters / Content updated October, 2020
Article written by Brian O’Connor, Community & Economic Development Specialist, Texas Main Street Program
Every person is a consumer of retail products since we all buy food, clothing, and other everyday necessities. Sometimes our dollars stay within the local economy or they leave as we travel outside our borders in search of the best value, product, or service. If our purchases stay locally, the benefits associated with them stay locally. And as we are all aware, as those dollars re-circulate within the local economy they facilitate economic growth.
For years, Main Street managers have played an important role in educating local citizens specifically on issues of retail competitiveness. As a result, Main Street cities have often outperformed other cities through the retention of local retail dollars. Simply stated, a community’s economic health is a measure of its ability to capture local as well as area consumer dollars.
However, in order for a community to measure its economic health it must first understand how the local market captures the spending patterns of local and regional consumers. One such technique for identifying such retail surpluses or leakages is called a Retail Gap Analysis. The technique sometimes called “a gap analysis” or “a supply and demand analysis” is relatively linear and Main Street Economic Restructuring committees are capable of performing the analysis. Texas Main Street communities can also request a Retail Gap Analysis from the TMSP Economic Development Specialist.
A retail gap analysis can be performed for specific categories of expenditures - such as food stores, apparel and accessories, furniture. (See Table 1, below.) A city must have access to sales tax collections by merchandise category typically in the form of Standard Industrial Classification (SIC code). Unfortunately, this type of data is not generally published and may have to be purchased through private vendors. However, check to see if your city may already compiled this information.
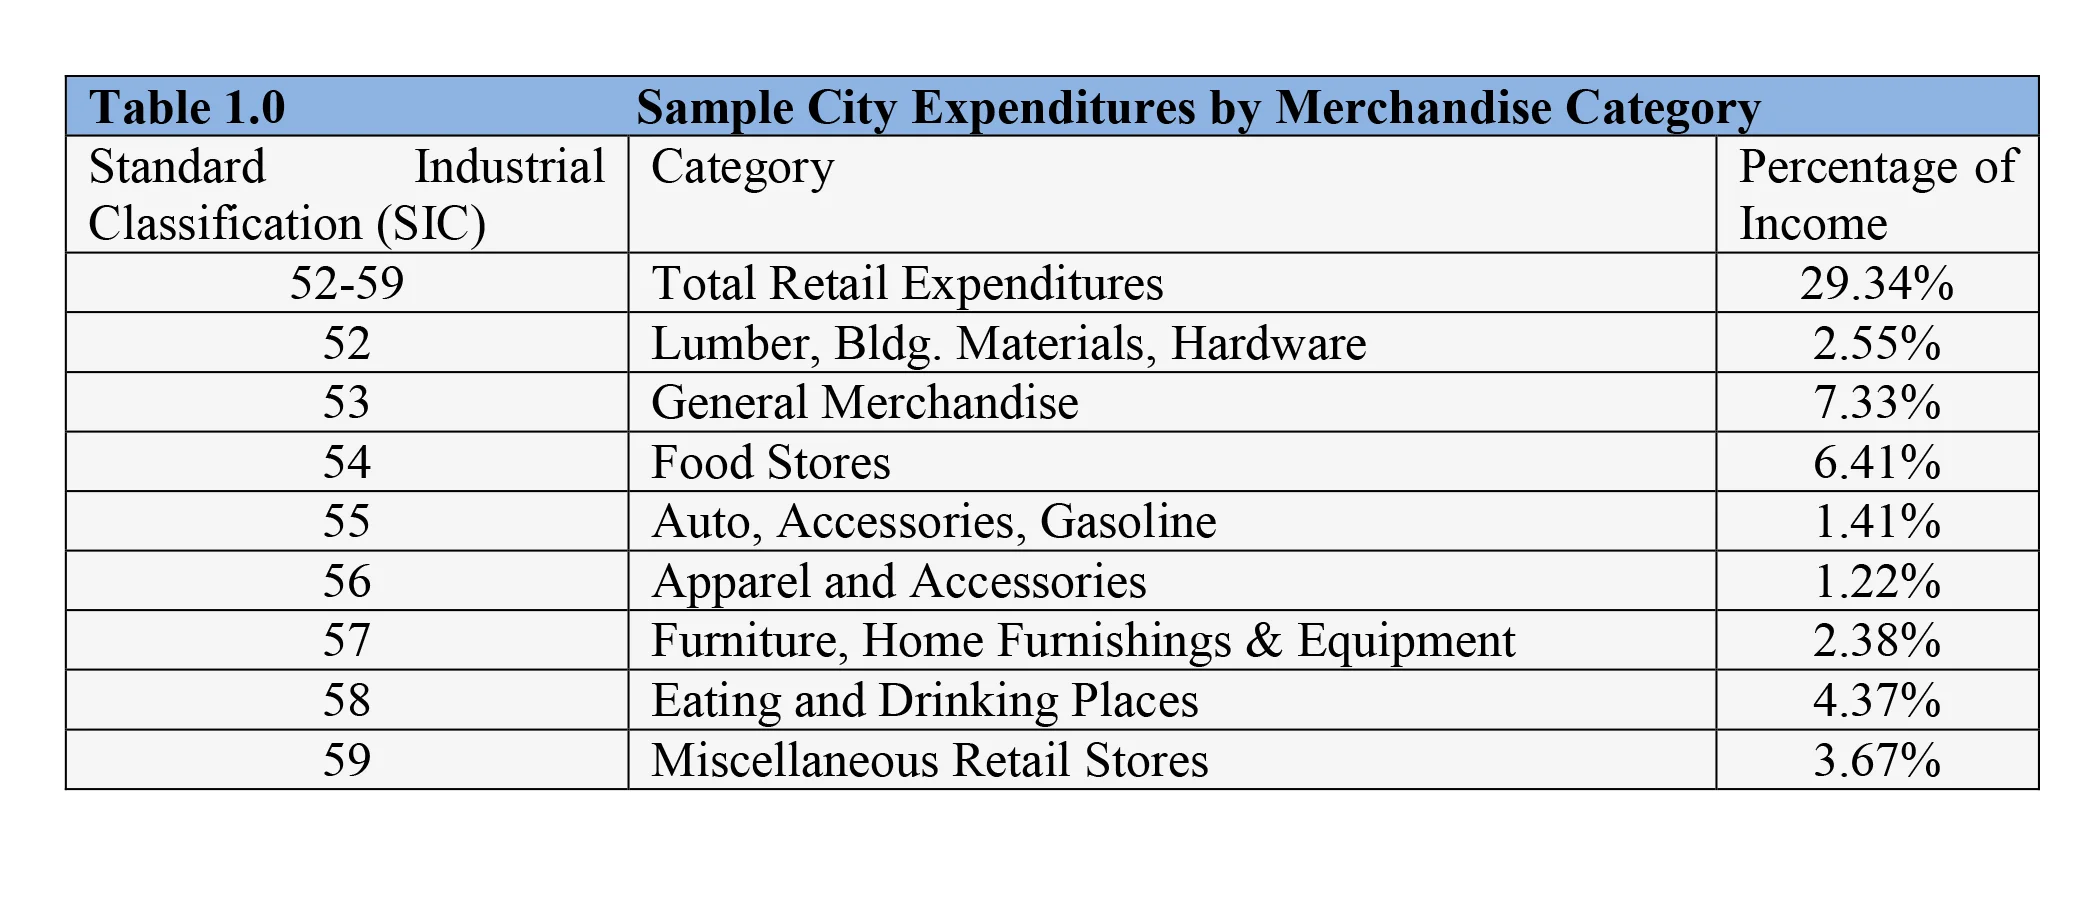
An example of sales by merchandise category. A retail gap analysis could be performed for each of these categories.
Essentially, the analysis estimates the number of shoppers coming to a community to purchase retail items. For example, if a city with a population of 1,000 is attracting 2,000 shoppers annually, the interpretation is that this community is not only attracting its own residents, but is also drawing in non-local customers. If that same city of 1,000 people was only attracting 500 shoppers, the implication would be that the city is not capturing the retail dollars of residents and that a significant amount of shopping outside the city is probably taking place.
Naturally, changing demographics, consumer trends, as well as other factors influence local consumption patterns and must be taken into consideration. For instance, older shoppers tend to have already acquired all the necessities in life and are in search of experiences rather than accumulating more goods. Therefore, their spending patterns favor those of full service restaurants, travel, and personal indulgences over household appliances, furniture, and equipment.
A common misconception to avoid is that if a retail gap exists, then it must be directly filled. For example, residents in a west Texas community wanted a coffeehouse, and a retail analysis confirmed a significant gap in the market. Unfortunately, a feasibility study showed that the city’s median household income was insufficient to support this type of business. Ultimately, the retail gap analysis proved meaningful because it encouraged a local bookstore to remodel to provide fresh-brewed coffee and pastries.
In its most basic terms, a retail gap analysis measures the differences between actual and potential sales. It does not indicate why such gaps are occurring, whether the gaps are desirable or not, or even how to stop them. It is up to the community to decide whether the gaps are acceptable or not and how best to address its needs.
Determining the sales gap coefficient is the critical part of the analysis as it indicates (1.0) whether a city is capturing the expenditures of its residents. A number less than 1.0 implies “leakage” and that resident are traveling outside the city for services. Whereas, a number greater than 1.0 implies “surplus” and that not only is the retail segment capturing resident expenditures but is also drawing consumers from outside the city.
The following ‘Sample City’ scenario is taken from U.S. Bureau of Labor Statistics and U.S. Census data sources and published case studies. Sample City is for instructional purposes only.
Follow the Gap Analysis Worksheet (Table 2), which outlines the process for calculating the retail gap coefficient. The coefficient indicates the degree to which a retail sector captures all local potential sales or loses some potential sales to out-of-county businesses.
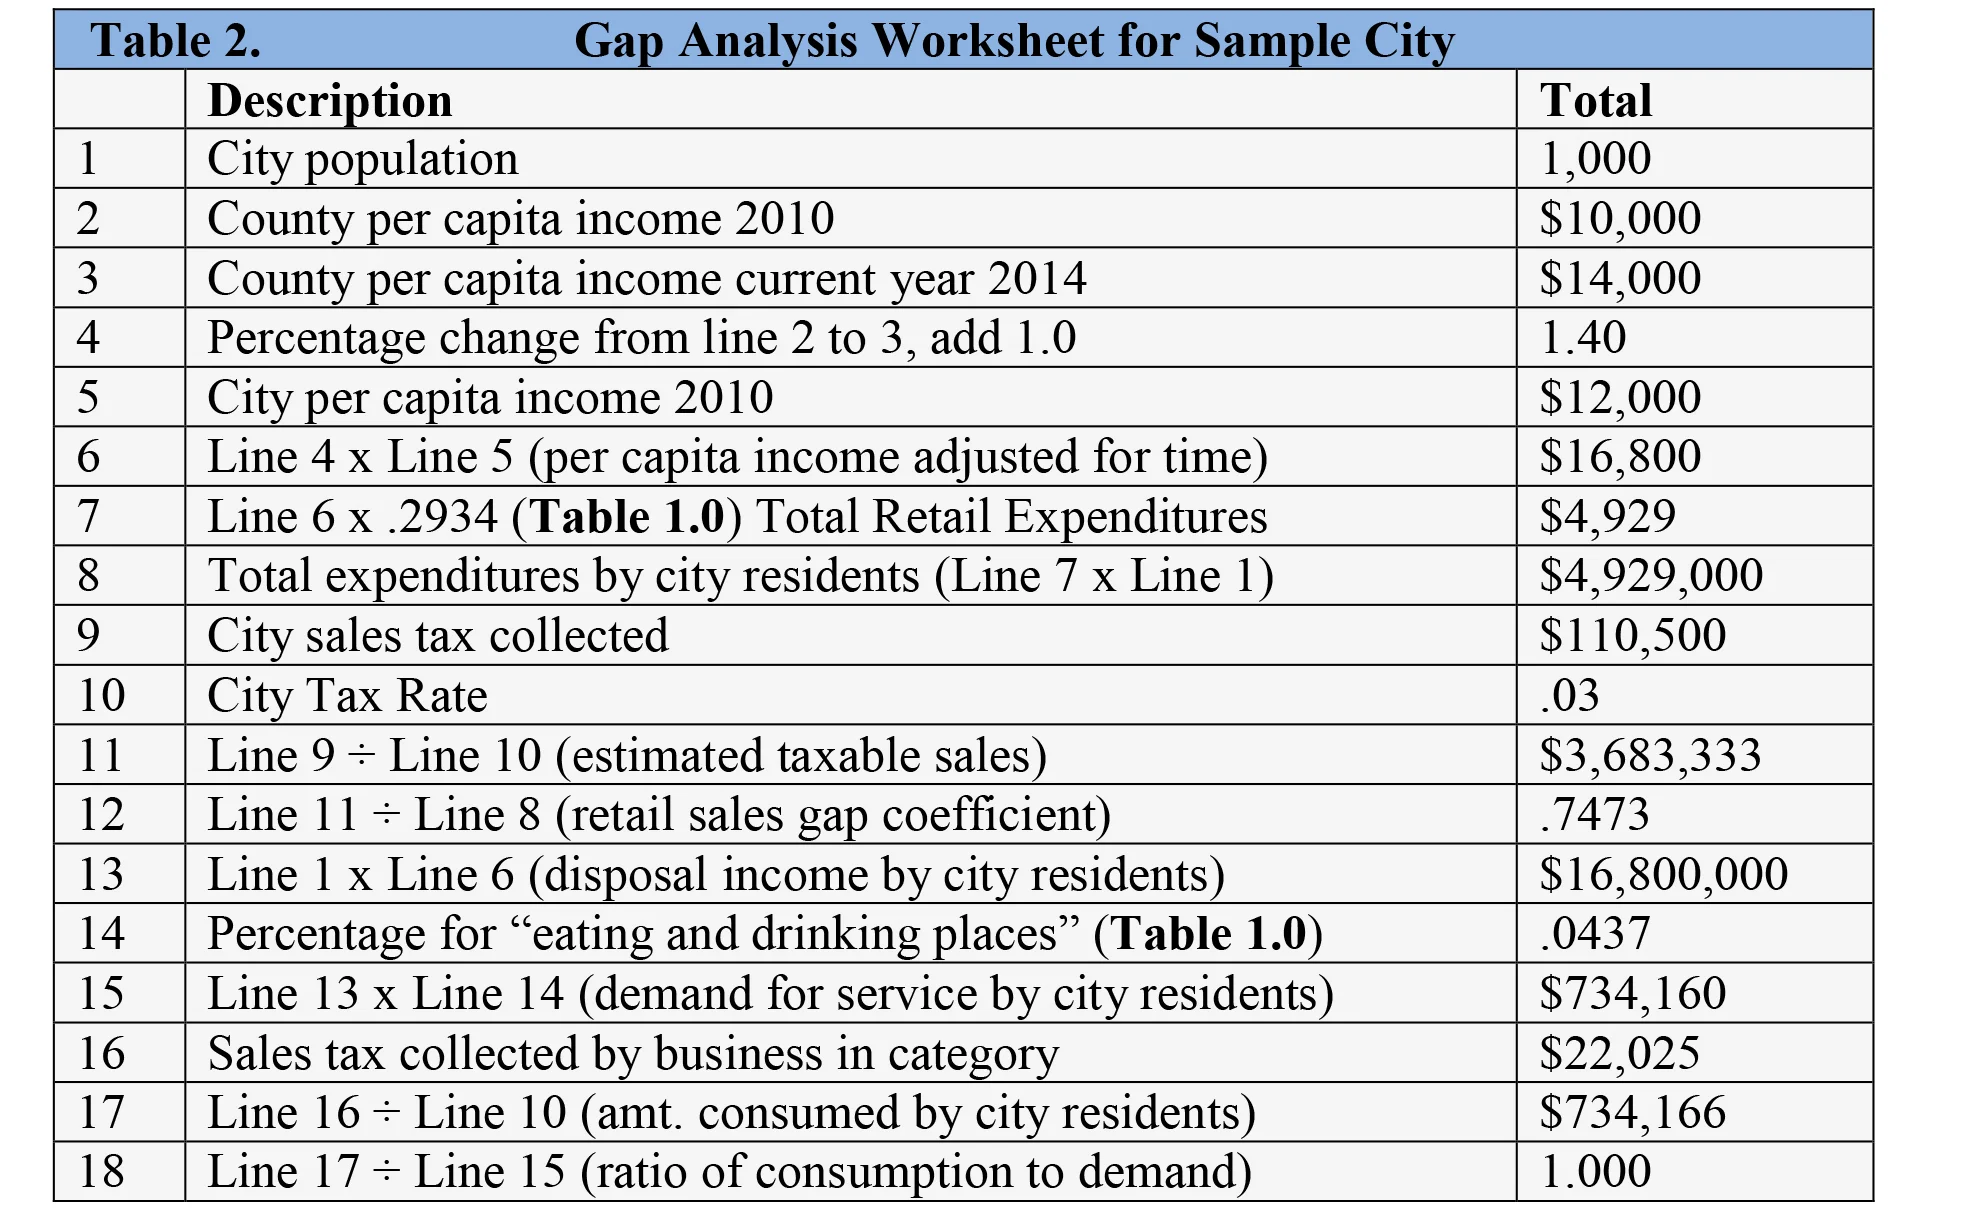
An example of a gap analysis worksheet.
Notice that Sample City (Table 2) registers a sales gap coefficient Line 12 of (.7473) which suggests that residents are leaving the city to shop for “eating and drinking places.” Consumers typically will not drive as far for full service restaurants, as other merchandise, and the capture rate for “eating and drinking places” in Sample City could be much higher if local offerings were improved. Let’s assume that Sample City registered a sales gap coefficient of .0437. Literally interpreted, Sample City is capturing only 57 cents of every $1.00 in potential retail sales and facing a substantial leakage of retail dollars in this category. These numbers are important as the retail sector accounts for a significant portion of local jobs and personal income and are an important source of tax revenues that fund health, education, and public safety.
Keep in mind that a retail gap analysis is only a starting point to stimulate further conversation. The analysis is only a means to facilitate plans and evaluate the progress of retail strategies over time. Do not be discouraged if the results of your analysis raise even more questions. The questioning and deliberation are all part of the journey and are a worthy guidepost.
Public Information Sources:
Bureau of the Census.
United State Department of Labor
An example retail gap analysis from Gaithersburg, MD is available here .